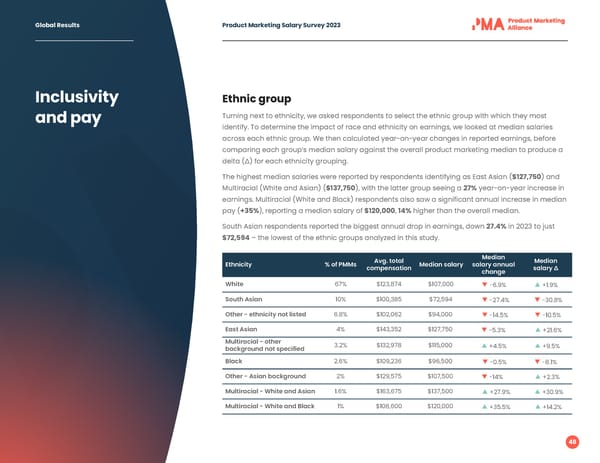
Global Results Product Marketing Salary Survey 2023 Inclusivity Ethnic group and pay Turning next to ethnicity, we asked respondents to select the ethnic group with which they most identify. To determine the impact of race and ethnicity on earnings, we looked at median salaries across each ethnic group. We then calculated year-on-year changes in reported earnings, before comparing each group’s median salary against the overall product marketing median to produce a delta (∆) for each ethnicity grouping. The highest median salaries were reported by respondents identifying as East Asian ($127,750) and Multiracial (White and Asian) ($137,750), with the latter group seeing a 27% year-on-year increase in earnings. Multiracial (White and Black) respondents also saw a significant annual increase in median pay (+35%), reporting a median salary of $120,000, 14% higher than the overall median. South Asian respondents reported the biggest annual drop in earnings, down 27.4% in 2023 to just $72,594 – the lowest of the ethnic groups analyzed in this study. Avg. total Median Median Ethnicity % of PMMs compensation Median salary salary annual salary ∆ change White 67% $123,874 $107,000 -6.9% +1.9% South Asian 10% $100,385 $72,594 -27.4% -30.8% Other - ethnicity not listed 6.8% $102,062 $94,000 -14.5% -10.5% East Asian 4% $143,352 $127,750 -5.3% +21.6% Multiracial - other 3.2% $132,978 $115,000 +4.5% +9.5% background not specified Black 2.6% $109,236 $96,500 -0.5% -8.1% Other - Asian background 2% $129,575 $107,500 -14% +2.3% Multiracial - White and Asian 1.6% $163,675 $137,500 +27.9% +30.9% Multiracial - White and Black 1% $108,600 $120,000 +35.5% +14.2% 48
 2023 | Global Salary Survey Page 47 Page 49